
Today’s forecast: scattered ice chunks with an 80% chance of flooding
Editor’s Note
This is Part 2 of Facebook gives scientists a front row seat on Northern ice breakup. That Simply Science article examines how Dustin Whalen, a physical scientist with the Geological Survey of Canada, is using Facebook and citizen science to study the progress of ice breakup in the Mackenzie River Delta.
By Jerri Southcott
June 7, 2018
In analyzing the Facebook data collected by the community, Whalen and his colleagues Paul Fraser and Don Forbes are making further discoveries of their own. With their research data now combined with citizen science information, it is much easier to predict where, when and for how long ice jams and the resulting flooding will occur.
While satellite images by themselves can suggest that flooding will probably occur in a certain area, attempts to specify when this will take place have largely been educated guesswork. But now, researchers can use the Facebook images of ice jams to pinpoint where the flooding is most likely to occur down river up to three days later.
“We’re now seeing the flood because people are showing the flooding in their own community and backyard,” says Whalen.
Citizen images validate science

Larger image
Ice road breakup on the Mackenzie River.
This additional data gives researchers a better sense of timing and other relevant information: how the river is behaving during ice breakup, how the water is flowing and the potential hazards to downstream communities.
“It’s an amazing validation of what we thought was already happening,” he says.
The excitement of these observations and their practical benefits continues to build for Whalen. This year, he installed a real-time camera at the mouth of the East Channel of the Mackenzie Delta Estuary to help observe the ice and ocean conditions. The weather and oceanographic observation station there is part of a collaboration with Department of Fisheries and Oceans.
“Now and until about mid June, in the Mackenzie Delta Estuary, all you see is ice. We’re going to keep an eye on that ice over time and see how it breaks up,” Whalen says. “But what we’re already noticing based on observations from the community is that in this section, where the camera is set up in Kugmallit Bay, the ice will just melt in place in the ocean.”
Predicting flow, ice and melt
This useful real-time knowledge, combined with the shared images from the community, is providing him with missing pieces of the puzzle, making it easier for scientists to determine not only when flooding may occur but also exactly how the ice melts out.
“What’s amazing is that from these images, we can now almost predict areas that are going to melt out versus break up and cause damage,” says Whalen.
Citizen science observations have also shown that the size of ice pieces and the amount of flow can vary. Once the Facebook page launched, Whalen could compare the Inuvik ice chunks with others posted by members of the group. The differences are sometimes surprising.
"The pictures I’ve seen over time — I think, wow, these are fairly significant chunks, this is probably why we see some of the natural changes along the river,” he says. “But then the Facebook group really encouraged other people from across the region to post their pictures of ice breakup, and the Inuvik chunks are nothing compared to the Norman Wells chunks [3,000 km upstream from Inuvik on the Mackenzie River near Great Bear Lake, Northwest Territories].”
Ordinary citizens collecting scientific data in their own communities have become important to researchers like Whalen. Engaging the public in scientific issues is a powerful way to tackle conservation challenges — and especially in the North, where the seasonal ice breakup affects virtually everyone. Willing participants are plentiful, and their contributions are always warmly welcomed by Whalen and his fellow researchers, whose work they support and help advance.
Island dweller is keenest observer
Gerry St. Amand lives in Inuvik. He joined the citizen scientist movement in the North long before the creation of the Facebook group. If anyone needs to keep track of the timing of the ice breakup in town, it’s St. Amand, who takes his boat to a cabin in the middle of the Mackenzie Delta when the water is open.
Larger image
Gerry St. Amand’s boat out on the water.
Photo by Gerry St. Amand.
He stays there until the ice breaks up and can take his boat back. All spring, surrounded by frozen water, St. Amand records the progression of the ice breakup and contributes to the collection of data by sharing his photos and videos on Facebook.
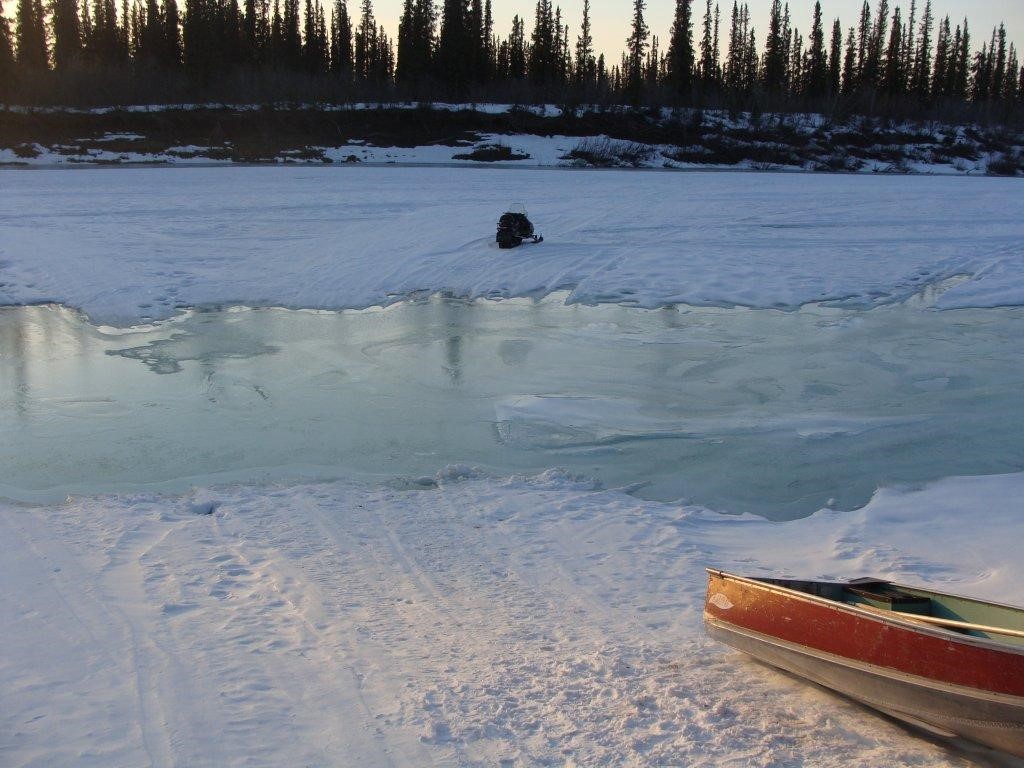
The very thin line between snowmobile and boat conditions during the spring ice breakup in the Mackenzie Delta.
Related stories
Page details
- Date modified: