
Impact Evaluation of the Renewable Energy Deployment (RED) Program
Audit and Evaluation Branch
Natural Resources Canada
December 30, 2020
Table of Contents
- List of acronyms
- Executive Summary
- Introduction
- Evaluation objectives and methods
- Evaluation limitations and mitigation strategies
- Findings: Impacts
- Findings: Relevance
- Conclusions
- Appendix 1: Evaluation team
- Appendix 2: RED Program Logic Model
- Appendix 3: Detailed list of the 18 case studies conducted
List of acronyms
- AEB
- Audit and Evaluation Branch
- DFO
- Fisheries and Oceans Canada
- ECCC
- Environment and Climate Change Canada
- ecoERP
- ecoEnergy for Renewable Power
- GBA+
- Gender-Based Analysis Plus
- GCWood
- Green Construction through Wood
- GHG
- Greenhouse Gas
- MREEM
- Marine Renewable Energy Enabling Measures
- NEB
- National Energy Board
- TC
- Transport Canada
- WPPI
- Wind Power Production Incentive
Executive Summary
About the Evaluation
This report presents the findings, conclusions, and lessons learned from the impact evaluation of the Natural Resources Canada (NRCan) Renewable Energy Deployment (RED) Program. The RED program assists in the development of a sustainable market in Canada for reliable and cost-effective renewable energy systems through the stimulation of demand and the development of enabling policy frameworks. The evaluation examined the results of the program for its activities during the 2002-03 to 2018-19 period. Actual expenditures for the program over this period were approximately $1.45 billion (B).
Given the purpose and level of maturity of the RED program, and the fact that the previous evaluation focussed on rationale, design and outputs, the purpose of the current evaluation was to capture the contribution of the RED program to social-economic and environmental impacts and other unintended outcomes.
What the Evaluation Found
Performance
Overall, the evaluation found that the RED program played a key role in supporting the wind and solar power sectors in their early years of development in Canada. Between 2001 and 2007, Wind Power Production Incentive (WPPI) and ecoEnergy for Renewable Power (ecoERP) combined supported the development of 4,442 megawatts (MW) or 84% of the total Canadian Wind energy capacity at that time.
The evaluation concluded that the RED program contributed to the reduction of a total of 85.7 megatonnes (Mt) of greenhouse gas (GHG) emission over a 12-year period (between 2008 and 2019). Overall benefits associated with the projects supported by RED equate to more than $12B when accounting for direct investments and social benefits. This amount combines the direct impacts on the gross domestic product (GDP) and the social benefits associated with lower GHG.
With respect to the impacts on GDP, the evaluation found that the investments and other expenditures involved in the projects funded by the RED program totaled $8.86B. In total 80,824 job-years were dedicated to developing and building the projects between 2006 and 2012 (or an average of 11,500 annual jobs for the period). Unfortunately, jobs created by the projects are not equally distributed among various social groups: women and Indigenous workers represent a relatively low share of the workforce employed, 18% and 5% respectively.
With respect to the social benefits associated with lower GHG, the conversion of the value of GHG reduced in dollars equates to $4.7B in benefits.
There is also evidence of significant impact on local economies. In addition to the job-creation, local businesses benefited from the construction and maintenance activities. In many cases, RED funded projects have led to direct revenues for local governments or entities. Many of the facilities are owned in total or in part by the municipalities. In some cases, owners of the facilities have negotiated agreements with local governments or land owners to share revenues. Case study evidence also demonstrates that some funded projects were instrumental for First Nations in developing their communities and investing in other renewable energy projects. About 40% of the case studies showed significant involvement and/or positive impacts for an Indigenous community.
Apart from the electrical power provided to the provincial grids (all projects were connected to provincial grids), many projects had positive impacts on policies and programs of the provincial/local power grid administrators.
The evaluation found that there are no significant negative impacts of funded projects on the natural environment and the fauna. All projects have been subject to an environmental impact assessment in accordance with the laws and regulations in force in the host province. No major negative impacts on the natural environment and fauna were reported.
With respect to Marine Renewable Energy Enabling Measures (MREEM), the evaluation found that it was successful in supporting the development of a legal framework for Canada for offshore renewable energy projects. There is an ongoing need for MREEM as regulations supporting legislation remain to be implemented and ongoing work related to land tenure continues.
The administration costs of the grants and contributions component of RED is deemed very low at less than 2% of the overall program costs.
Relevance
Overall, RED is aligned with government priorities, the need for new energy sources, and Canada’s international commitments with respect to GHG emission reductions. RED is also in line with NRCan’s mandate, which includes encouraging the sustainable development and responsible use of natural resources. There was also a need for the program to kick-start projects, reduce the financial risk for investors, and grow the sectors. Overall, RED was deemed complementary to provincial and territorial measures to support alternative renewable energy sources.
Lessons Learned
- The program’s funding model based on performance ($ per KW/h) is appreciated by users.
- Program needs appear greater in some provinces, e.g., where no government support is available or where there is extensive use of fossil fuels to generate electricity. Future similar programs could further target these areas where the net impact is greatest. Regions where renewable energy sources are well established could host research projects funded by the program instead of support for production.
- The program clearly addresses a market failure: although most projects would not have been financially viable without RED, the benefits calculated largely exceed the program costs (and operators’ costs).
- Employment impacts are not distributed equally between men, women and Indigenous populations. Although there are good examples of projects involving Indigenous communities and workers, future programming should incorporate Gender-based Analysis Plus (GBA+) targets and plans.
- MREEM project helped to develop a legislative framework. There remains an opportunity to further support the development of regulations for offshore renewable projects.
Introduction
This report presents the findings, conclusions, and lessons learned from the impact evaluation of the Natural Resources Canada (NRCan) Renewable Energy Deployment (RED) Program. This evaluation focuses on the assessment of performance and impacts, but also addresses relevance and continued need issues. It covers the period 2002-03 to 2018-19 and NRCan expenditures for all activities stemming from the three components of the RED program (see program description below).
NRCan’s Audit and Evaluation Branch (AEB) undertook the evaluation between September 2019 and January 2020. It was conducted in accordance with the Treasury Board Policy on Results (2016), Section 42.1 of the Financial Administration Act and in response to a Treasury Board commitment to evaluate the program by March 2020.
Program Information
The RED program assists in the development of a sustainable market in Canada for reliable and cost-effective renewable energy systems through the stimulation of demand and the development of enabling policy frameworks.
Program expenditures for RED totalled $1.45 billion (B) between 2002 and 2019. Further breakdowns of these expenditures are provided in the report (See Table 2). It is comprised of three components:
- Wind Power Production Incentive (WPPI): $285.2 Million (M)
- ecoEnergy for Renewable Power (ecoERP): $1.16B; and
- Marine Renewable Energy Enabling Measures (MREEM): $2.8M.
The WPPI program ended in March 31, 2007 and was replaced by the ecoERP program which expanded wind energy generation technology to hydro, biomass, and solar energy projects.
Wind Power Production Incentive (WPPI)
The WPPI program began in 2002. It was intended to provide incentives to support the development of 1,000 megawatts per hour (MWh) of new wind power capacity and the delivery of 2.6 terawatt-hours (TWh) of electricity over a 15-year period. WPPI provided a direct subsidy per kilowatt-hour (kWh) of wind energy produced, from 1.2 cents (1.2¢) down to 1.0 cent (1.0¢) depending on the start date of a project. Projects funded were located in Alberta (AB), Ontario (ON), Saskatchewan (SK), Québec (QC), and Nova Scotia (NS); with an especially strong wind production capacity in AB.
ecoEnergy for Renewable Power (ecoERP)
Under ecoERP, launched in April 2007, the production incentive approach of WPPI was replicated not only for wind projects, but also for biomass, low-impact hydro, geothermal, solar photovoltaic (PV), and ocean (tidal) energy. Photovoltaics systems are non-emitting energy sources, while combustion-based technologies, such as biomass and landfill gas, may be required to demonstrate that their installations will result in emissions reductions.
ecoERP provided a direct subsidy of one cent (1.0¢) per kWh for eligible production during the projects’ first 10 years of operation. The incentive was to help to close the price gap between low-impact renewable generating sources and conventional electricity sources. Although the program stopped signing new contribution agreements (CAs) on March 31, 2011, payments will continue to be made until 2020/21, the final year of CAs.
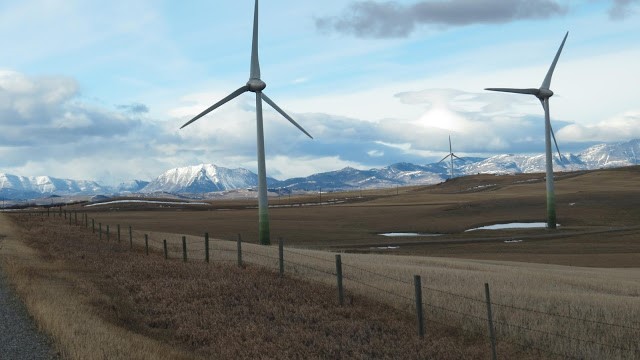
Castle Rock Ridge Wind Project, Pincher Creek, Alberta (Enel Green Power: Castle Rock Ridge Wind Project)
Marine Renewable Energy Enabling Measures (MREEM)
Initiated in 2011-12, the MREEM was designed to develop a set of federal policy and regulatory options and recommendations for administering marine renewable energy in offshore areas where authorization of such projects is a federal responsibility. MREEM’s $10.5M in funding was obtained through three Treasury Board submissions, which allocated $4M for 2011-12 to 2015-16, $1.5M for 2016-17 to 2017-18, and $5M for 2018-19 to 2027-28. Expenditures of $2.8M over 8 years (2011-12 to 2018-19) resulted in policy and legislative-related deliverables.
Evaluation objectives and methods
The evaluation examined the results of the program for its activities during the 2002-03 to 2018-19 period. The last evaluation of the RED program was completed in 2015, covering the period 2010-11 to 2014-15. The 2015 evaluation, which considered both relevance and performance issues, provided an assessment of achievement of the outcomes of the same three program components (WPPI, ecoERP and MREEM). Overall, the 2015 evaluation, concluded that the achievement of expected results have been demonstrated for both WPPI and ecoERP, but partially demonstrated for MREEM because it was too early to measure intermediate outcomes.
The previous evaluation also confirmed that conducting an impact evaluation was feasible given the type of performance information collected by the program and the information available.
Given the purpose and level of maturity of the RED program, and the fact that the previous evaluation focussed on rationale, design and outputs, the purpose of the current evaluation was to capture the contribution of the RED program to social-economic and environmental impacts and other unintended outcomes.
For this purpose, a new logic model was designed to capture both intended and unintended impacts of RED program (See Appendix 2).
The impact evaluation used three main lines of evidence, consisting of qualitative and quantitative data:
Document Review
A review of program documents (incl. NRCan and federal government strategic and corporate documents) and literature with a focus on sources relating to the relevance of renewable energies at the national and international levels.
This line of evidence informed findings across all questions of the evaluation.
Case Studies

A total of 18 case studies based on 32 interviews (1 to 3 by case) with project proponents, provincial authorities and the review of available projects data and documents. Additional specific outcomes data were obtained from project proponents to inform case studies and the economic analysis including projects costs (capital, labour and maintenance), revenues and employment and spin-off businesses.
The case studies provided an in-depth description of program impacts and allowed for a cross-case analysis.
Database Review 
A targeted review of project-specific financial, economic and performance data compiled by the program and obtained from the case studies.
An economic impact analysis based on program data and Statistics Canada input/output tables and emissions data from the United Nations’ (UN) International Panel on Climate Change (IPCC).
Case Studies Selection and Distribution
A purposeful selection of cases (versus a random selection) was conducted to ensure representation of funded projects according to the following main criteria:
- Province (location of projects): Province was considered as a criterion as each province has a distinct energy profiles and policies with respect to grid operation and renewables energies.
- Technology (Wind, Hydro, Biomass, Solar): Technology was used as a criterion as each are unique and are likely to produce different levels of impacts and lessons learned from a program management perspective.
Project production (in kWh) and program component (WPPI and ecoERP) were also considered. A specific case study was conducted on the MREEM program.
Overall, the completed 17 case studies on ecoERP and WPPI funded projects represents 29% of projects and 34% of actual total production funded by the RED program. All technology types are represented in case studies.
The projects selected for case studies cover most provinces. Only three provinces are not included in the case studies (Manitoba [MB], NS and SK) for which a relatively low number of projects were supported by the RED program (MB: two projects; NS: nine projects; and SK: three projects).
Table 1 presents the distribution of cases and interviews by type of technology and respondent. Appendix 5 provides a detailed list of case studies, including project and proponent names, fiscal year commissioned, project capacity (MW) and actual production (kWh).
| Cases/projects | Interview Respondents | |||||||
|---|---|---|---|---|---|---|---|---|
| Technology | # of case studies | # of sites | Proponents / Industry | Project Partners | Provincial Gov’t | Federal Gov’t | Grid Operation / Authority | Total |
| Wind | 7 | 16 | 9 | 1 | 3 | 13 | ||
| Hydro | 7 | 9 | 9 | 2 | 1 | 12 | ||
| Biomass | 2 | 2 | 2 | 2 | ||||
| Solar | 1 | 8 | 1 | 1 | ||||
| MREEM* | 1 | -- | 1 | 2 | 3 | |||
| Total | 18 | 35 | 22 | 2 | 2 | 2 | 3 | 31 |
* Marine Renewable Energy Enabling Measures (MREEM) project led by NRCan
Evaluation limitations and mitigation strategies

- The evaluation’s scope and approach were calibrated in recognition of the need for the conduct of an impact-focused evaluation, an opportunity identified in the previous evaluation (2015). As such, the evaluation expended less effort in examining areas where there have been no or few known changes to the programming context (e.g., relevance and government roles and responsibilities).
- The challenges were mostly associated with securing the participation of interview respondents for the selected case studies. Many projects are more than a decade old and it was difficult to reach respondents who are knowledgeable about the projects at implementation and about the RED program in general. We mitigated this challenge by including back-up projects to mitigate the risks of non-responses to participation solicitations. In total, we had to replace eight (8) case studies with alternative, but similar projects.
- We considered the views of funded project proponents to be well represented in our case study analysis. However, we did not obtain the perspectives of provincial and grid operation authorities for a number of case studies because it was not possible to secure the participation of respondents identified with the help of project proponents. Where possible, we mitigated this limitation by considering secondary evidence reviewed in the context of the document review and specific web searches to supplement case study documentation.
- Following our request to fill a data entry form, many case study respondents were not in a position to provide complete quantitative project information (i.e., projects costs, revenues and employment and spin-off businesses).
- Particularly related to program effectiveness, the evaluation relies heavily on secondary data provided by the program and its proponents. The evaluation team has not audited this data. The ecoERP program was audited in 2012 and there were no findings that could indicate reliability or completeness issues with the program data.
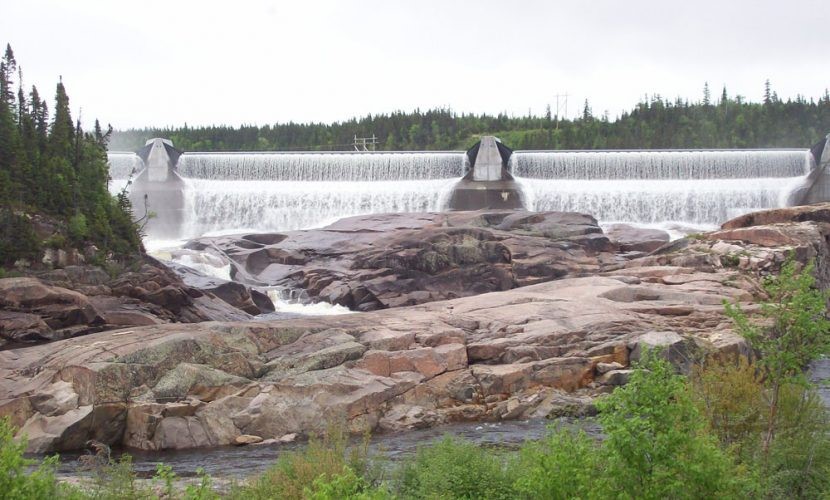
Magpie Hydroelectric Project, Minganie Regional County, Québec
(Innergex: Magpie Hydroelectric Project)
Findings: Impacts
Summary:
MREEM was successful in supporting the development of a legal framework for Canada for offshore renewable energy projects, through the development of policy papers, jurisdictional reviews and the conduct of consultations with government, industry and Indigenous stakeholders. There is an ongoing need for MREEM as regulations supporting legislation remain to be implemented and ongoing work concerning land tenure continues.
The program played a significant supporting role in the development of new renewable energy capacity in Canada. Prior to ecoERP and WPPI, there was limited wind and solar power capacity in Canada. Data indicates that the RED program played a key role in supporting the sector in its early years of development in Canada. Between 2001 and 2007, the combined support of WPPI and ecoERP facilitated the development of 4,442 MW or 84% of the total Canadian wind energy capacity at that time.
Based on the assumption that in most provinces, the implementation of new renewable energy sources is a substitution for fossil-fueled production sites (i.e., coal and gas), the evaluation concluded that the RED program contributed to the reduction of a total of 85.7 megatonnes (Mt) of GHG emission over a 12-year period (between 2008 and 2019).
The administration costs of the grants and contributions (G&Cs) component of RED is deemed very low at less than 2% of the overall program costs. The evaluation also found that the program generated significant impacts on the Canadian economy. The construction of the sites and the ongoing maintenance work generated significant investments and expenditures. In terms of dollars, the data indicate that the investments and other expenditures involved in the projects funded by the RED program totaled $8.86B. In total, 80,824 job-years were dedicated to developing and building the projects between 2006 and 2012 (or an average of 11,500 annual jobs for the period). According to calculations using Statistics Canada input-output (I/O) tables, investments generated as a result of the program generated benefits five times greater than those associated with typical government expenditures. It also represents five times the expected program total operating subsidies. Unfortunately, jobs created by the projects are not equally distributed among various social groups: women and Indigenous workers represent a relatively low share of the workforce employed, 18% and 5% respectively.
Benefits were also calculated based on the social benefits associated with lower GHG. Using data generated by the Inter-Agency Working Group (IAWG), the evaluation team converted the value of GHG (in terms of CO2 emissions) at $42.43/tonne in real 2016 US dollars ($56.21 CAN$) to attain the amenity value of the above GHG savings. In dollars this equates to $4.7B in benefits. Overall benefits associated with the projects supported by RED equate to more than $12B when accounting for direct investments and social benefits.
There is also evidence of significant impact on local economies. In addition to the job creation, local businesses benefited from the construction and maintenance activities. In many cases, RED funded projects have led to direct revenues for local governments or entities. Many of the facilities are owned in total or in part by the municipalities. In some cases, owners of the facilities have negotiated agreements with local governments or land owners to share revenues. Case study evidence also demonstrate that some funded projects were instrumental for First Nations in developing their communities and investing in other renewable energy projects. About 40% of the case studies showed significant involvement and/or positive impacts for an Indigenous community.
Apart from the electrical power provided to the provincial grids (all projects were connected to provincial grids), case study evidence also indicates that many projects had positive impacts on policies and programs of the provincial/local power grid administrators.
According to case study evidence, the evaluation found that there are no significant negative impacts of funded projects on the natural environment and the fauna. According to project documentation, all projects have been subject to an environmental impact assessment in accordance with the laws and regulations in force in the host province. No major negative impacts on the natural environment and fauna were reported. Solar projects appear to be less disruptive than wind due to lower visual and noise impact.
Natural conditions affecting the production and maintenance costs, grid connection costs and provincial support to new renewable energy sources are the main factors affecting the success of the projects funded by RED.
Mreem played a key supporting role in developing a regulatory framework for offshore renewable energy projects
The evaluation assessed the extent to which the policy work performed by MREEM contributed to the achievement of expected outcomes of the program. According to the logic model, MREEM was expected to lead to the following immediate and intermediate outcomes: increased knowledge of policy framework issues and options among government and industry stakeholders; Canada has a framework for the administration of marine renewable energy in the federal offshore; and increased production of marine renewable energy. Offshore renewable energy projects can include wind, wave, and tidal energy projects.
Context. Statistics from the Global Wind Energy Council indicate that in 2017, worldwide offshore production capacity (i.e., what existing wind sites can potentially produce) was 18,658 MWFootnote 1, and this capacity is expanding. In 2017, production sites of 4,472 MW were installed, representing about 25% of the total offshore capacity.
Canada's coastline is the world's longest, measuring 243,042 km (Statistics CanadaFootnote 2) and yet, there are still no offshore renewable energy projects, such as wind sites, located within its territorial waters. According to one industry source, the main reason for this situation would be the low-cost energy alternativesFootnote 3. However, until 2019, there was also a lack of a legal and regulatory framework to clarify to the authorities how to efficiently administer marine renewable energy in the federal offshore for wider adoption of these technologies. No legislation clearly identified responsibility for approving projects in offshore federal land. According to the Oceans Act, in any area of the sea not within a province, the federal Crown has ownership over the seabed and subsoil, and jurisdiction to regulate activities in the internal waters of Canada, the territorial sea and the exclusive economic zone. However, offshore operations also involve provincial/territorial approvals as they would ultimately connect to power grids under these provincial/territorial authorities.
In this context, the initial objective of MREEM was to develop a comprehensive legislative framework for administering marine renewable energy development (offshore wind, wave, and tidal energy projects) in the federal offshore. This was to be done in a series of steps in which MREEM was to play a key role. As indicated in the logic model, MREEM was expected to provide knowledge about regulatory issues and options, and to contribute to the development of an appropriate regulatory framework.
Policy Papers. MREEM played a lead role in the development of a regulatory framework that ultimately took the form of new legislation passed in 2019. During the first program cycle (2011-2015), MREEM produced a policy paper that examined selected international marine renewable energy management regimes and potential options in Canada. This jurisdictional review was conducted and published in 2014. It provided an overview of the management regimes and regulatory frameworks within the following six countries: Denmark; Germany; the Netherlands; Scotland; the United Kingdom; and the United States (US). A background paper was also developed and used for consultation purposes. According to interviews, there was an outreach effort towards other federal and provincial departments/agencies to seek information and advice about potential roles and responsibilities of the various government organizations concerned with offshore operations, including DFO, Transport Canada (TC), Environment and Climate Change Canada (ECCC), the National Energy Board (NEB) and provincial/territorial governments. There was also outreach to industry and industry associations for their input. A workshop in Halifax was conducted. After the scan and the outreach activities were completed, a final policy paper was produced in 2015.
Discussion Paper. In the following program cycle (2016-17 to 2017-18), MREEM was to conduct legal analyses on the development of the legislative framework; pan-Canadian stakeholder consultations; targeted technical studies on a range of complex issues to inform the development of the legislative framework; and development of legislative drafting instructions. A discussion paper was drafted by MREEM in March 2016. The paper laid out the issues and proposed directions to address these through a regulatory framework. These included:
- Authorizations for offshore land use for marine renewable energy exploration and development;
- Authorizations for activities related to exploratory work, and the construction and operation of marine renewable energy projects and their associated transmission lines delivering electricity from the offshore project back to the onshore electrical grid;
- Operational safety, to ensure that a facility is constructed and operated to recognized standards, and is reliable, safe and minimizes environmental impacts;
- Occupational health and safety, that focuses on the rights of employees to work in a safe environment; and
- Environmental Protection.
The paper discusses these issues and presents how other jurisdictions have framed these issues into their regulatory frameworks. The paper also presents options for Canada. According to NRCan respondents, Canada’s six coastal provinces and three territories were approached, as well as Indigenous Treaty groups and associations (with the assistance of what was then INAC). Nine industry associations (renewable energy, petroleum, fishing, transport, etc.) were also approached to obtain their views, as well as 13 non-government organizations, the NEB, the Canadian Environmental Assessment Agency, and the Offshore Petroleum Boards. Some declined the invitation.
Three consultation sessions were held in 2016-17. According to an association representative, the discussion paper clearly identified the gaps and the issues. It also identified what would not be applicable (e.g., what is under provincial legislation) in Canada. Respondents said that NRCan was “very good at making itself available” for those wanting to provide input and participate in consultations. The options for Canada developed in the Discussion paper were deemed viable by most participants to the consultations. Industry and other stakeholders expressed concerns about uncertainties with respect to overlaps between federal and provincial jurisdictions. According to a MREEM representative, the consultations led to adjustments to the draft legislation.
In 2017, MREEM/NRCan worked with the Department of Justice to help develop the new legislation. The legislation was drafted and MREEM was engaged in providing responses to questions from the Parliament working committee, and the Senate committee that examined the legislation. The new Canadian Energy Regulator Act (Bill 69) was passed in August 2019. The purpose of the Act is to regulate certain energy matters within Parliament’s jurisdiction, including to ensure that pipelines and power lines as well as facilities, equipment or systems related to offshore renewable energy projects, are constructed, operated and abandoned in a manner that is safe, secure and efficient and that protects people, property and the environment. Specifically, part 5 of the Act specifies that the Commission (named by the regulator under the Act) is responsible for authorizing work or activity in relation to an offshore renewable energy project or to an offshore power line, as well as work or activity that is proposed to be carried on to construct, operate or abandon any part of an offshore power line that is in a province.
According to interview respondents, the main outcome of the Act is that it clearly identifies a process for authorizing projects, including timelines. The respondent from an industry association said that future projects would not happen without this legislation. According to NRCan, more detailed safety and environmental protections are now being developed under the Canadian Energy Regulator Act and will be implemented in the years ahead.
However, a NRCan respondent said that the issue of offshore land tenure is not covered by the new legislation. Currently, PSPC (Public Services and Procurement Canada) has authority on all federal real property, including federal lands that are not otherwise designated under the authority of another federal department for a specific purpose. For offshore seabed land with a view for energy development purposes, this responsibility has not been delegated to NRCan and remains under the authority of PSPC. It was explained that one of the objectives of MREEM is currently to work with PSPC in developing a land tenure regime for renewable energy projects in the federal offshore. Alternatively, NRCan will work with PSPC to facilitate the transfer of this land tenure authority from PSPC to NRCan, whereby NRCan would develop and maintain an offshore renewable energy land tenure regulatory regime.
The program played a significant supporting role in the development of new renewable energy capacity in Canada
According to literatureFootnote 4, there was limited capacity in Canada in alternative renewable energy in 2001. In solar (photovoltaic) production, Canada had 9 MW in capacity, while capacity from wind turbines was 214 MW. In comparison, wind capacity in the US was 4,245 MW in 2001. Hydro has been a mature sector for decades in Canada, with production/consumption reaching 331.6 TW in 2001, while production/consumption from nuclear plants was 76 TW that same year.
According to the following evidence, the implementation of WPPI and ecoERP coincided with significant increases in wind power capacity in Canada, and suggests that the programs played a significant role in developing this renewable energy source in Canada.
Statistics Canada data indicates that there was 214 MW in wind energy capacity in Canada in 2001, and this capacity grew to 1,841 MW in 2007. During that same period, WPPI alone supported the development of 924 MW in wind capacity. In other words, WPPI supported 924 MW of the 1,628 MW (56%) in new wind energy capacity during that five-year period. Between 2007 and 2011, Canadian wind capacity grew an additional 3,845 MW (reaching 5,625 MW). During that same period, ecoERP supported the development of 3,518 MW in wind energy capacity. Therefore, between 2001 and 2007, WPPI and ecoERP combined supported the development of 4,442 MW or 84% of the total Canadian wind energy capacity at that time. Since that time, Canadian capacity continued to grow, reaching 12,804 MW in 2018. Data therefore suggests that the RED program played a key role in supporting the sector in its early years of development in Canada (Figure 1).
Figure 1: Wind Energy Installed Capacity in Canada (1993-2014)
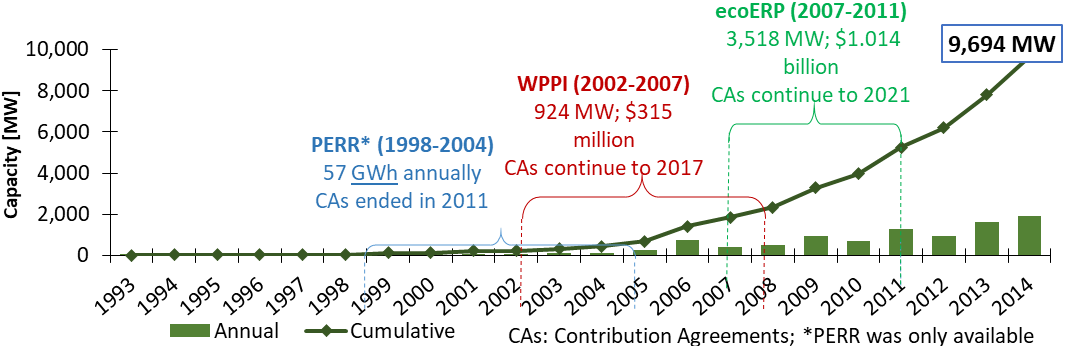
Source: Statistics Canada and program data
Text version
Figure 1 displays the wind energy installed capacity in Canada over the period of 1993 to 2014, on both an annual and a cumulative basis. The installed capacity is measured in megawatts. The figure shows that wind energy installed capacity has increased over the time period, going from only 1 megawatt in 1993 to reaching a cumulative capacity of 9,694 megawatts in 2014. The figure also indicates the time period where certain incentive programs were in effect. From 1998 to 2004, a Purchase of Electricity from Renewable Resources program was in effect, with contribution agreements ending in 2011. From 2002 until 2007, the Wind Power Production Incentive was in effect, with contribution agreements continuing until 2017. From 2007 until 2011, the ecoEnergy for Renewable Power incentive was in effect, with contribution agreements continuing until 2021.
The program had a significant impacts on GHG reduction
According to program data, combined with Statistics Canada data, the RED program contributed to the reduction of a total of 85.7 Mt of GHG emission over a 12-year period (between 2008 and 2019).
The evaluation assessed the impacts of power sites supported by RED by assuming that in many provinces, they would in fact be substituting production based on fossil fuels, namely coal and gas. Using Statistics Canada data on provincial production of electricity, the evaluation calculated the substitution effect, which was higher in some provinces than others. The substitution effect also varied in time as it coincided with some provincial efforts to reduce the use of coal for generating electricity. Overall for Canada, GHG reduction results of the calculation by year appear in the Figure 2. They total 85.7 Mt of GHG reduced.
Figure 2. GHG Reduced (Mt) as a Result of Projects Funded by RED programs
%20-%20EN.jpg)
Sources: Compiled by GGI from program data and Statistics Canada data
Text version
Figure 2 displays the greenhouse gas (GHG) reduced, measured in Megatonnes (Mt), as a result of projects funded by RED Programs, from the year 2008 until 2019. In 2008, 1.25 Mt of GHG was reduced. In 2009, 2.3 Mt of GHG was reduced. In 2010, 4.42 Mt of GHG was reduced. In 2011, 7.12 Mt of GHG was reduced. In 2012, 9.17 Mt of GHG was reduced. In 2013, 9.38 Mt of GHG was reduced. In 2014, 9.37 Mt of GHG was reduced. In 2015, 9.32 Mt of GHG was reduced. In 2016, 9.31 Mt of GHG was reduced. In 2017, 9.3 Mt of GHG was reduced. In 2018, 8.13 Mt of GHG was reduced. In 2019, 6.6 Mt of GHG was reduced.
Wind, hydro and solar production sites produce very little GHG once electricity production starts (some GHG is involved in the construction). Some ecoERP biomass power projects do register some GHG emissions as their production is based on combustion. However, in the case of methane produced by the landfills, untreated methane is a powerful greenhouse gas, with a global warming effect 21 times greater than CO2. Given that methane would be produced by the landfills in the absence of biomass projects, the implementation of biomass powered electricity production sites actually equates to a net reduction in GHG as it reduces methane emissions. Only four projects (out of 104) were Biomass projects.
The returns or benefits of the RED program exceeded the program costs
The evaluation assessed program efficiency and whether the returns or benefits of the RED program exceeded the program costs. As shown in Table 2, total expenditures for the program were $1.4B between 2002 and 2019. As shown in the table, the administrative cost for WPPI and ecoERP, that had G&Cs components, was less than 2% of their budgets.
It should be mentioned that based on the documentation review, the funding model ($0.01 dollar contribution per KWh produced) is a somewhat rare funding model for the federal government. According to interview findings, this model is appreciated by the private sector as it is easy to manage and it is results oriented.
As for the associated benefits, the evaluation evidence shows that these stem from various sources.
As shown in the logic model (see Appendix 2), in addition to the expected outcomes of increased renewables energy capacity and reduced GHG emissions, there are multiple unexpected impacts (co-benefits) associated with WPPI and ecoERP. Many of these impacts can be associated with benefits quantified in terms of dollars.
| Component | Salary | Operations & Maintenance (O&M) |
G&C | Total | % of admin. costs |
|---|---|---|---|---|---|
| WPPI | $2,338 | $766 | $282,146 | $285,251 | 1.1% |
| ecoERP | $6,260 | $2,191 | $1,155,175 | $1,163,626 | 0.8% |
| MREEM | $1,629 | 1,202 | 2,831 | ||
| RED - Total | $10,227 | $4,159 | $1,437,321 | $1,451,708 |
Note: Admin costs defined as salary and O&M costs.
Source: Compiled by GGI from data provided by the RED program.
A typical project would involve the construction/renovation of a facility, followed by a power generation phase, which involves the generation of electricity with very low GHG emissions. The implementation phase also involves maintenance activities at the production site. From a benefits perspective, these phases are associated with a number of benefits, including:
- Capital Investments to build the power-generating facility
- Job creation, both for the construction phase and the maintenance activities
- Spin-off contracts for the private sector that own the facility
- Value of GHG saved
The RED program had a significant economic impact, both on GDP and job creation, five times greater than those associated with typical federal government expenditures of the same magnitude.
The evaluation team calculated the impacts on the economy (GDP) based on Statistics Canada I/O tables, using administrative data and case study data. Administrative data provided detailed information on the power generated by the sites that received funding, as well as the capital investments. The case study data provided information jobs created for the maintenance phases, as well as the spin-off effects (e.g., businesses created).
In terms of dollars, the data indicate that the investments and other expenditures involved in the projects funded by the RED program totaled $8.86B (in 2006-2012). As shown in Figure 3, expenditures for infrastructure development and construction peaked between 2009 and 2011.
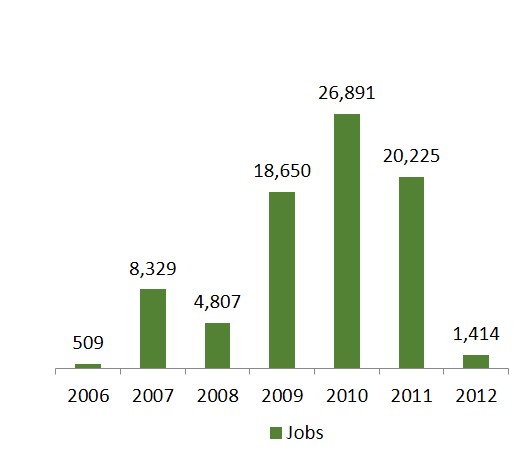
From a job creation perspective, the projects generated significant jobs during the construction phases of the projects. According to data and I/O tables 80,824 total job-years were dedicated to developing and building the projects between 2006 and 2012 (or an average of 11,500 annual jobs for the period). Jobs created peaked in 2010, as shown in Figure 4.
Using Statistics Canada I/O tables, the evaluation team compared this economic impact with the typical economic impact stemming from government expenditures. According to the tables, investments generated as a result of the program generated benefits five times greater than those associated with typical government expenditures. It also represents 5.0 times the expected program total operating subsidies 2008-2022 of $1.8B. Similarly, the RED program generated 5.3 times the number of jobs as typical federal government expenditures of the same magnitude.
Figure 3: Impacts on GDP of RED Program from Infrastructure Development and Construction (2006-2012, Millions CDN $)
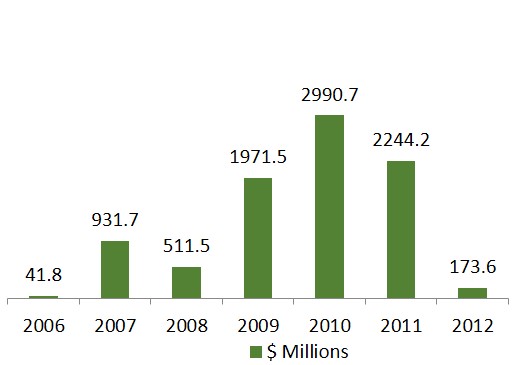
Sources: Compiled by GGI from program data and Statistics Canada data
Text version
Figure 3 displays the impacts on GDP of the RED Program from infrastructure development and construction over the time period of 2006 until 2012. GDP is measured in millions of Canadian dollars. In 2006, the RED Program contributed $41.8 million to GDP. In 2007, the RED Program contributed $931.7 million to GDP. In 2008, the RED Program contributed $511.5 million to GDP. In 2009, the RED Program contributed $1971.5 million to GDP. In 2010, the RED Program contributed $2990.7 million to GDP. In 2011, the RED Program contributed $2244.2 million to GDP. In 2012, the RED Program contributed $173.6 million to GDP.
Figure 4: Number of Jobs Generated from RED Projects (2006-2012)
Sources: Compiled by GGI from program data and Statistics Canada data
Text version
Figure 4 displays the number of jobs generated from RED Program projects over the time period of 2006 until 2012. In 2006, 509 jobs were generated. In 2007, 8,329 jobs were generated. In 2008, 4,807 jobs were generated. In 2009, 18,650 jobs were generated. In 2010, 26,891 jobs were generated. In 2011, 20,225 jobs were generated. In 2012, 1,414 jobs were generated.
Benefits associated with GHG avoided
As mentioned above, in addition to the benefits associated with the construction of the facility, the evaluation team calculated the benefits associated with GHG reduction. Using administrative data, and taking into account which alternate power source it would replace, the GHG avoided equates to 86 Mt of CO2 equivalent during subsidized period.
The evaluation team converted the GHG in dollars. As GHG is associated with many negative social impacts, including impacts on human health (respiratory and heart diseases, diabetes, etc.), the IAWG and IPCC estimated the social costs of GHG per metric tonFootnote 5. In other words, the reduction of GHG can be associated with healthier populations and lower use of health system that involve costs. Using data generated by the IAWG, the evaluation team converted the value of GHG (in terms of CO2 emissions) at $42.43 per tonne in real 2016 US dollars ($56.21 CAN$) to attain the amenity value of the above GHG savings. In dollars this equates to $4.7B in benefits. This is a conservative estimate given that most facilities will continue to operate for several years to come, based on case study evidence.
Impact on local economies – especially for men
Case study evidence provides real-life examples of the impacts on the local economies. Many of the jobs during the construction phase as well as for the maintenance and management of the power facilities, are positions held by individuals located in the region or municipality that host the facilities.
According to case study data (n=17), 77% of the jobs were created for the facility construction. Only 23% of the jobs created are maintained for maintenance and operation. Also, women and Indigenous workers represent a relatively low share of the workforce employed, 18% and 5% respectively. This is low given that most of these projects were in rural areas and many near Indigenous communities.
While limited number of jobs were created and maintained for the operation of facilities after construction, projects are heavily relying on independent services organizations (ISO) for facility maintenance and other specialized technical services. For example, three funded projects were pioneering wind farms in the Gaspésie region and had requirements for at least 60% of regional content. The projects supported the development of the palms and towers manufacturing industry, construction and maintenance expertise in the region. The two plants that are still in operation employ hundreds of local workers (500+ workers) and are now mainly exporting towers and palms, mostly in the US. According to case study interviews, these wind farms projects also contributed to the development of several ISO. According to a recent study, the wind power industry generates 25M annually in regional economic impact for the communities.Footnote 6
More directly, RED funded projects have led to direct revenues for many community organisations and local governments (for about 50% of the projects, according to the case studies). Many of the facilities themselves are owned in total or in part by the municipalities, which benefit from the profits generated by the sites. This was especially true for smaller scale hydro dams owned or co-owned by municipalities. In some cases, these smaller dams were either bought from private sector operators (e.g., paper mill companies), or from larger utility corporations that prefer to operate larger facilities (e.g., Hydro-Québec). Some municipalities reported that the revenues allowed critical regional investment and local government to lower the tax burden of their constituencies.
In some cases, owners of the facilities have negotiated agreements with local governments to share revenues (e.g., royalty agreements). Some have lease payment arrangements with local land owners. Some companies have made efforts to maintain good relationships with the community, such as by organizing annual dinners or by funding local social events. Given the impact of the neighbouring land owners, some companies provide specific compensations. For example, PEI Energy Corporation has developed a “bull’s eye” system where landowners are compensated based on their proximity with the wind farm installations and given a percentage of overall gross revenue.
Impact on First Nations communities
Case study evidence also demonstrates that some funded projects were instrumental for First Nations in developing their communities and investing in other renewable energy projects. Among completed case studies, seven (7) projects had significant involvement and/or positive impacts for an Indigenous community.
For example, in the context of the Umbata Falls Hydroelectric Project (ON), the Ojibways of the Pic River First Nation community is partner at 51% with Innergex. After 30 years of operation, this First Nation community will own 100% the facility. As a result, this community is receiving important revenues and is benefiting in terms of socio-economic development. The Ojibways of the Pic River First Nation community created a non-profit service organization that funds community business development, day care center in which women can go to work and educational enhancements including bus school transportation, a new medical clinic and the acquisition and operation of motels. A learning center was also established with state-of-the-art multimedia and teleconferencing facilities. Importantly, the Umbata fall project was instrumental for the community to invest 100% ownership into another hydroelectric project on the same river, the Twin Falls Generating Station. This project is leveraging experience with the Umbata fall project that is relying on contractual services suppliers for operation and maintenance. In QC (Côte-Nord), the Innu Ekuanitshit community also receive financial compensation from the revenues of the Magpie Hydroelectric Project.
In addition to employment and training provided to First Nations, one community is now connected to the power grid as a result of the hydropower projects developed at Harrison Lake/Stave River in British Columbia (BC) (they relied on diesel generators prior to the project). Finally, in the context of the Sarnia Solar projects in ON, the operator partners with a local Indigenous community (Chippewa Nation) and sponsors a local education program. The Indigenous community also built a wetland on the site.
Impact on Human Resource (HR) development and training programs
Case study evidence also indicates that many local production sites played a key supporting role in the area of HR development. In four cases (about 20% of the total), the local production sites partnered with local colleges to develop training programs and/or research programs.
A wind power park in AB, for example, helped develop a wind energy technical program at the local community college, with staff instructing there. In some cases, while the sites do not play an active role in the program, they open their doors to students for educational purposes. A solar farm in ON, for example, offers tours of the site for a local college for educational purposes on a regular basis. Finally, in the Gaspésie region in QC, a post-secondary technical education program specific to the maintenance of wind turbines helps develop HR for the industry in the region.
Impact on Provincial grids
Apart from the electrical power provided to the provincial grids (all projects were connected to provincial grids), case study evidence also indicates that many projects had positive impacts on policies and programs of the provincial/local power grid administrators.
In some cases, the projects were the first of their kind for the power grid administrators to manage. Connecting to the grid led to the development of policies regarding electricity standards, how the connection will be made, how the energy will be managed, metered, etc. For example, one of the solar projects funded by RED - the largest solar farm at the time - helped shape the policies of the grid operator for the other panel projects that followed in ON.
Some projects were deemed challenging from a grid management perspective. For example, a wind project in Newfoundland (NFLD) created concerns because of the anticipated fluctuations in power (from low and high winds). In this case, the fluctuations were more difficult to manage due to the fact that the area is located on an island and is not connected to a wider grid. Fortunately, the other power sources were sufficient to compensate. In QC, one case study indicated that a wind farm actually contributed to stabilize the power supply to the grid. Other projects, however, have different connection types to the regional grids and cannot compensate for other power failures in the grids.
Impact on the Natural Environment and Fauna
According to case study evidence, the evaluation found that there are no significant negative impacts of funded projects on the natural environment and the fauna. According to project documentation, all projects have been subject to an environmental impact assessment in accordance with the laws and regulations in force in the host province.
Many funded wind farm projects involved pre- and post-construction monitoring of impacts on avian and bats, and on noise. Cumulative impacts of noise from the projects (and several other wind farms nearby) have been raised as an issue during the approval process for subsequent projects in the same regions. However, limited birds and bats mortality have been reported and the results showed that noise levels were within the accepted range. Most of the run-of river hydroelectric power generating plant projects were developed with a view to minimizing environmental impacts. A number of wind and hydro projects modified the construction of facilities to further minimize impacts on fauna:
- Fermeuse Wind Farm, South of St. John's (NFLD): The proponent built a specific bird tower because the initial environmental impact study revealed that local Osprey birds were building nests in the wind farm infrastructure.
- Magpie Hydroelectric Project, Côte-Nord Area (QC): The proponent is required to maintain ecological reserved flow and to monitor impacts on upstream and downstream migration of the American eel, brook trout and Atlantic salmon. In terms of mitigation measures, a specific upstream system (migratory pass) has been set up downstream of the dam to facilitate migration of the American eels. The project had to comply with both environmental and aesthetic requirements, which are considered as positive by interviewees. The visual aspect of the waterfall and landscaping were improved (trails and footbridge over one arm of the river, picnic and interpretation areas).
- Umbata Falls Hydroelectric Project, Lake Superior North Shore Area, Marathon (ON): The project had requirements to maintain the debit of the waterfall to respect ecological criteria, but also aesthetic criteria (timed control of the debit in touristic peak hours). During project development, adepts of recreation and paddling activities through this river and the national park became sources of opposition to the project. On the fish habitat side, concerns were expressed for spawning sites for pike and pickerel. According to interviewees, everything was put in place to mitigate the impact on fish populations. The proponent had to maintain the level of the waterfall, but mainly for aesthetic reasons (timed control of the debit in touristic peak hours). The proponent had to compensate and restore ecological aquatic habitats destroyed for the construction of the project. Also, the proponent built a belvedere for access and sightseeing of the waterfall.
- Trent Rapids G.S., Peterborough (ON): The environmental assessment led to a number of mitigation measures, including the protection of snake nesting areas and the construction of ponds.
- Kwalsa Energy (Phase I) and Upper Stave Energy (Phase II) Projects (BC): There were concerns that these types of projects will harm local fish populations because of the diversion of water resources for the purposes of hydro production, which reduces water flow for fish. The proponent was required to offset any potential issues by compensating for fish habitat. Additionally, there was no harm done to the local fish population. In fact, the reduced water flows in what is traditionally a difficult habitat for fish to thrive in, have led to an improvement in the fish population in these now lower flow river areas.
- East Toba and Montrose Creek in BC: The dam structures put in place allow for water to be diverted to the sites’ powerhouse and return it back to the stream from which it came and therefore creates minimal impact on the resource. One net benefit of the project is that it purposefully created some salmon enhancement areas to support salmon spawning.
Solar projects appear to be less disruptive than wind due to lower visual and noise impact. In the context of Sarnia Solar Projects (1-8): The proponent, in partnership with a non-governmental organization (NGO), restored habitat on a 200-acre parcel of land within the 1,100-acre solar farm. The unused land was the home to hickory trees and some wetlands. The project involved the planting of native bushes and poppies, according to interviews. Some invasive species such as phragmite were removed. The solar farm received a Go Green Award from the City of Sarnia as a result of its efforts.
Factors affecting the success of the RED
Case study evidence and administrative data provide information about various factors that have affected the success of RED, including the following:
- Natural conditions. At the project level, the energy outputs of the projects were in many cases different than what was anticipated (in terms of MW outputs). In most projects, natural conditions such as intensity of wind, solar and water (hydro) sources were different than anticipated (in some cases higher, others lower). Also, some cases were challenged by harsher conditions than expected, including impact of wind, cold and salt water conditions on the equipment. For example, turbines located close to the shore can lead to faster than anticipated erosion of blades.
- Grid connection costs. In a few instances, case study evidence indicates that projects faced higher-than-expected costs to connect to the power grid. In some cases, connections to the grid were delayed due to technical issues.
- Provincial support. In some cases, support for wind energy projects changed during the timeframe due to changing provincial governments. The support often took the form of a more or less advantageous rate for the electricity sold to the grid. In one case, it may be a deciding factor whether the project will continue as the rates have been lowered significantly as a result of a change in government.
What We Found
Relevance
Findings: Relevance
Summary:
Overall, RED is aligned with government priorities, the need for new energy sources, and Canada’s international commitments with respect to GHG emission reductions. RED is also in line with NRCan’s mandate, which includes encouraging the sustainable development and responsible use of natural resources. There was also a need for the program to kick-start projects, reduce financial risks for investors, and grow the sectors. None of the projects generated sufficient market revenues to be profitable without the RED funding. The majority of the supported projects generated sufficient revenues to attain small surpluses with which they could pay-off some of their capital costs. Overall, RED was deemed complementary to provincial and territorial measures to support alternative renewable energy sources.
There was a recognized need for RED
Overall, RED is aligned with government priorities and NRCan’s mandate. Investments in renewable energy programs were announced in federal budgets 2003, 2007, 2010, as well as in 2016-2017. In 2004, the Speech from the Throne made explicit mention of Canada’s desire to be a leader in clean technologies “to reduce air pollution and greenhouse gas emissions”. RED stemmed from a need to consolidate the growing energy needs of Canadians, while answering the call to reduce GHG emissions, address climate change and pursue sustainable development objectives.
RED explicitly aimed to increase the proportion of renewable energy in Canada's electricity grid. The development of renewable energy would namely contribute to Canada’s Copenhagen Accord objective of a 17% reduction in GHG emissions by 2020 compared to 2005 levels. When the first iteration of RED was launched, there was a need for programming to help industry kick-start renewable energy projects, in sectors that did not or barely existed in Canada at the time.
The MREEM initiative emerged from the lack of offshore renewable energy regulation. The establishment of a legislative framework could further improve the investment climate for technologies and projects instrumental in producing clean electricity. Today, there is global recognition of a need to support the transition to low-carbon energy production. The federal government has continued to announce and launch new programming to further diversify the portfolio of renewable energy sources available to reduce GHG emissions in the electricity sector.
The federal government has the authority to support alternative energy, including through production incentives. At the time of the ecoERP and WPPI design, production incentives were seen as an effective mechanism to support development for renewable energy. The Program was also aligned with NRCan’s legislated mandate, which includes encouraging the sustainable development and responsible use of natural resources.
All case study respondents said that there was a need for the program to kick-start projects, reduce the financial risk for investors, and grow the sectors. Some said that there was a need for a federal program to compensate for certain important costs, for grid connection costs and price fluctuations on provincial grid, for instance. The funding served as an incentive for some international proponents to establish themselves in Canada, reducing financial risks and accelerating the implementation of projects.
The analysis of the financial information was also revealing of the importance of the program from a financial perspective: None of the projects generated sufficient market revenues to be profitable without the RED funding. However, the majority of the projects generated sufficient revenues (including RED) to attain small surpluses with which they could pay-off some of their capital costs. With respect to potential duplications, there are various provincial/territorial support measures related to renewable energy in the form of tax credit, net metering, research and development, guaranteed purchase prices, etc. The evaluation found that despite a few exceptions where federal and provincial initiatives might have been duplicative, RED was overall complementary to provincial and territorial measures. RED was a unique program within NRCan, with no other program providing the same incentives to the same sectors. In the vast majority of the case studies we reviewed, RED was the only source of federal support in a project.
Conclusions
Relevance
Overall, RED is aligned with government priorities, the need for new energy sources, and Canada’s international commitments with respect to GHG emission reductions. RED is also in line with NRCan’s mandate, which includes encouraging the sustainable development and responsible use of natural resources. There was also a need for the program to kick-start projects, reduce the financial risk for investors, and grow the sectors. None of the projects generated sufficient market revenues to be profitable without the RED funding. The majority of the supported projects generated sufficient revenues (including RED) to attain small surpluses with which they could pay-off some of their capital costs. Overall, RED was deemed complementary to provincial and territorial measures to support alternative renewable energy sources.
Effectiveness
According to findings, MREEM was successful in supporting the development of a legal framework for Canada for offshore renewable energy projects. There is an ongoing need for MREEM as regulations supporting legislation remain to be implemented and ongoing work related to land tenure continues.
Data indicates that the RED program played a key role in supporting the wind and solar power sectors in their early years of development in Canada. Between 2001 and 2007, WPPI and ecoERP combined supported the development of 4,442 MW or 84% of the total Canadian Wind energy capacity at that time.
The evaluation concluded that the RED program contributed to the reduction of a total of 85.7 Mt of GHG emission over a 12-year period (between 2008 and 2019).
Overall benefits associated with the projects supported by RED equate to more than $12B when accounting for direct investments and social benefits. This amount combines the direct impacts on the GDP and the social benefits associated with lower GHG.
- With respect to the impacts on GDP, the evaluation found that the investments and other expenditures involved in the projects funded by the RED program totaled $8.86B. In total 80,824 job-years were dedicated to developing and building the projects between 2006 and 2012 (or an average of 11,500 annual jobs for the period). Unfortunately, jobs created by the projects are not equally distributed among various social groups: women and Indigenous workers represent a relatively low share of the workforce employed, 18% and 5% respectively.
- With respect to the social benefits associated with lower GHG, the conversion of the value of GHG reduced in dollars equates to $4.7B in benefits.
There is also evidence of significant impact on local economies. In addition to the job-creation, local businesses benefited from the construction and maintenance activities. In many cases, RED funded projects have led to direct revenues for local governments or entities. Many of the facilities are owned in total or in part by the municipalities. In some cases, owners of the facilities have negotiated agreements with local governments or land owners to share revenues. Case study evidence also demonstrates that some funded projects were instrumental for First Nations in developing their communities and investing in other renewable energy projects. About 40% of the case studies showed significant involvement and/or positive impacts for an Indigenous community.
Apart from the electrical power provided to the provincial grids (all projects were connected to provincial grids), case study evidence also indicates that many projects had positive impacts on policies and programs of the provincial/local power grid administrators.
The evaluation found that there are no significant negative impacts of funded projects on the natural environment and the fauna. According to project documentation, all projects have been subject to an environmental impact assessment in accordance with the laws and regulations in force in the host province. No major negative impacts on the natural environment and fauna were reported.
The administration costs of the G&Cs component of RED is deemed very low at less than 2% of the overall program costs.
Lessons Learned
- The program’s funding model based on performance ($ per KW/h) is appreciated by users.
- Program needs appear greater in some provinces, e.g., where no government support is available or where there is extensive use of fossil fuels to generate electricity. Future similar programs could further target these areas where the net impact is greatest. Regions where renewable energy sources are well established could host research projects funded by the program instead of support for production.
- The program clearly addresses a market failure: although most projects would not have been financially viable without RED, the benefits calculated largely exceed the program costs (and operators’ costs).
- Employment impacts are not distributed equally between men, women and Indigenous populations. Although there are good examples of projects involving Indigenous communities and workers, future programming should incorporate Gender-based Analysis Plus targets and plans
- MREEM project helped to develop a legislative framework. There remains an opportunity to further support the development of regulations for offshore renewable projects.
Appendix 1: evaluation team
Michel Gould, Chief Audit and Evaluation Executive (CAEE)
Christian Asselin, Former Chief Audit and Evaluation Executive (CAEE)
David Ash, Senior Advisor to the CAEE
Olive Kamanyana, Program Evaluation Manager
Aishwarya Babu, Analyst
Alvine Djomo Happi, Student
Goss Gilroy Inc.
Appendix 2: RED Program Logic Model
Program
Marine Renewable Energy Enabling Measures (MREEM)
Wind Power Production Incentive (WPPI)
ecoEnergy for Renewable Power (ecoERP)
Activities
- Conduct legal research and analysis
- Conduct policy research and analysis of international approaches
- Consult with stakeholders
- Evaluate and assess project proposals for eligibility
- Provision of financial incentives for production of electricity from eligible low-impact renewable energy
- Monitoring of program performance and report results
Outputs
- Legal opinions
- International comparison study
- Stakeholders consultation meetings
- Background paper
- Contribution agreements, amendments, and innovation agreements
- Audits, environmental assessments, performance reviews, technical reviews, and annual reports
Intended Outcomes
Co-benefits and other impacts
Immediate
Outcomes
Increased knowledge of policy framework issues and options by federal, provincial, industry stakeholders, and by Cabinet
Increased renewable energy capacity and generation by utilities and independent power producers
Intermediate
Outcomes
- Canada has a framework for the administration of marine renewable energy (MRE) in the federal offshore
- Increased production of MRE
Increased capacity and generation of low-impact renewable energy in Canada contributing to reduced greenhouse gas (GHG) emissions
- Development of Renewable Energy Industry in Canada
- Economic development in local communities
- Impacts on Indigenous communities
- Impacts on gender and other diverse populations
- Impacts on natural environment
- Benefits associated with reduced GHG
- Reduced GHG in North America
- Development of Highly Qualified Personnel and training programs
Ultimate
Outcomes
Greater experience in Canada with low-impact renewable power generation and capacity
Text version
Appendix 2 displays the logic model for the RED Program. The logic model consists of the following components: Programs, Activities, Outputs, Intended Outcomes, Co-benefits and Other Impacts, Immediate Outcomes, Intermediate Outcomes, and Ultimate Outcomes. Programs involve activities which produce outputs. These outputs lead to intended outcomes, co-benefits and other impacts, and immediate, intermediate, and ultimate outcomes. The programs include: Marine Renewable Energy Enabling Measures (MREEM); the Wind Power Production Incentive (WPPI); and ecoEnergy for Renewable Power (ecoERP).
The MREEM program involves the following activities: Conduct legal research and analysis; Conduct policy research and analysis of international approaches; and Consult with stakeholders. These activities produce outputs including Legal opinions; an International comparison study; Stakeholders consultation meetings; and a Background paper. These outputs lead to the immediate outcome of Increased knowledge of policy framework issues and options by federal, provincial, industry stakeholders, and by Cabinet. The intermediate outcomes of this program are as follows: Canada has a framework for the administration of marine renewable energy (MRE) in the federal offshore; and increased production of MRE.
The WPPI program and EcoERP program involve the following activities: Evaluate and assess project proposals for eligibility; Provision of financial incentives for production of electricity from eligible low-impact renewable energy; and Monitoring of program performance and report results. These activities produce outputs including Contribution agreements, amendments, and innovation agreements; and Audits, environmental assessments, performance reviews, technical reviews, and annual reports.
The WPII and EcoERP programs also lead to both intended and unexpected outcomes. The intended immediate outcome is increased renewable energy capacity and generation by utilities and independent power producers. The intended intermediate outcome is increased capacity and generation of low-impact renewable energy in Canada contributing to reduced greenhouse gas (GHG) emissions. The unexpected impacts of the programs, referred to as Co-Benefits and Other Impacts, include: Development of Renewable Energy Industry in Canada; Economic development in local communities; Impacts on Indigenous communities; Impacts on gender and other diverse populations; Impacts on natural environment; Benefits associated with reduced GHG; Reduced GHG in North America; Development of Highly Qualified Personnel and training programs.
The ultimate outcome of all three programs is a greater experience in Canada with low-impact renewable power generation and capacity.
Appendix 3: detailed list of the 18 case studies conducted
| # | Tech. | CS Name | Prov. | Proponent | # of projects | Comp. | Project Number | Project Name(s) | Capacity (MWh) | FY Commis. | Total Actual Production (kWh) |
|---|---|---|---|---|---|---|---|---|---|---|---|
| 1 | Wind | Caribou Wind Farm | NB | Caribou Wind Park Limited Partnership | 1 | ecoERP | 5911-C23-1 | Caribou Wind Park (Phase I) | 99.0 | FY10 | 1,914,611,863 |
| 2 | Wind | Parc éoliens (Anse-à-Valleau, Baie-des-Sables, Carleton) | QC | Cartier énergie éolienne Inc. | 3 | ecoERP | 5911-C10-3 | Parc éolien de l'Anse-à-Valleau | 100.5 | FY08 | 2,875,129,644 |
| ecoERP | 5911-C10-2 | Parc éolien de Baie-des-Sables | 109.5 | FY08 | 2,924,530,394 | ||||||
| ecoERP | 5911-C10-1 | Parc éolien de Carleton | 109.5 | FY09 | 3,147,336,209 | ||||||
| 3 | Wind | Kruger Energy Port Alma and Chatham Wind Farm Projects | ON | Kruger Energy | 2 | ecoERP | 5911-K9-1 | Kruger Energy Chatham Wind Project | 101.20 | FY11 | 3,105,342,240 |
| ecoERP | 5911-K2-2 | Kruger Energy Port Alma Wind Power Project | 101.20 | FY09 | 3,104,492,160 | ||||||
| 4 | Wind | Castle Rock Ridge Wind Project | AB | Castle Rock Ridge Limited Partnership | 1 | ecoERP | 5911-W2-1 | Castle Rock Ridge Wind Project | 75.9 | FY12 | 1,123,722,104 |
| 5 | Wind | East Point & North Cape Phase II Wind Farms Projects | PE | PEI Energy Corporation | 2 | ecoERP | 5911-P3-2 | East Point Wind Plant | 30.0 | FY08 | 900,739,726 |
| WPPI | 5902-P3-1 | North Cape Wind Farm-Phase II | 5.3 | FY04 | 101,714,715 | ||||||
| 6 | Wind | Fermeuse Wind Farm | NL | Fermeuse Wind Power Corp. | 1 | ecoERP | 5911-S10-6 | Fermeuse Wind Project | 27.0 | FY10 | 828,273,600 |
| 7 | Wind | Summerview Wind Park Phase II | AB | TransAlta Corporation (acquired Vision Quest WindElectric Inc.) | 6 | ecoERP | 5911-T6-2 | Blue Trail Wind Farm | 66.0 | FY10 | 1,498,000,466 |
| ecoERP | 5911-T6-3 | Summerview Wind Farm Phase II | 66.0 | FY10 | 1,280,480,270 | ||||||
| ecoERP | 5911-T6-4 | Ardenville Wind Farm | 69.0 | FY11 | 1,451,549,420 | ||||||
| WPPI | 5902-V1-5 | Summerview Wind Farm Phase I | 68.4 | FY05 | 1,324,700,729 | ||||||
| WPPI | 5902-V1-2&3 | McBride Lake Windfarm | 75.2 | FY04 | 1,393,564,556 | ||||||
| WPPI | 5902-V1-1 | Summerview Wind Turbine | 1.8 | FY03 | 33,379,771 | ||||||
| 8 | Hydro | East Toba River & Montrose Creek Hydroelectric Project | BC | Toba Montrose General Partnership (TMGP) | 1 | ecoERP | 5913-P7-2 | East Toba River & Montrose Creek Hydroelectric Project | 234.6 | FY11 | 5,049,776,939 |
| 9 | Hydro | Kwalsa Energy (Phase I) and Upper Stave Energy (Phase II) Hydro Projects | BC | Harrison Hydro Limited Partnership | 2 | ecoERP | 5913-H3-1 | Kwalsa Energy Project (Phase 1 Harrison Hydro Project) | 90.0 | FY10 | 3,471,901,370 |
| ecoERP | 5913-H3-2 | Upper Stave Energy (Phase 2 Harrison Hydro Project) | 60.0 | FY11 | 2,542,087,671 | ||||||
| 10 | Hydro | Madawaska Hydrodam Modernization Project | NB | Edmundston Energy | 1 | ecoERP | 5913-E13-1 | Madawaska Hydrodam Modernization Project | 4.1 | FY12 | 163,594,508 |
| 11 | Hydro | Umbata Falls Hydroelectric Project | ON | Umbata Falls Limited Partnership | 1 | ecoERP | 5913-U2-1 | Umbata Falls Hydroelectric Project | 23.6 | FY09 | 1,065,191,198 |
| 12 | Hydro | Trent Rapids G.S | ON | Trent Rapids Power Corporation | 1 | ecoERP | 5913-T8-1 | Trent Rapids G.S. | 8.0 | FY10 | 242,242,209 |
| 13 | Hydro | Magpie Hydroelectric Project | QC | Magpie Limited Partnership | 1 | ecoERP | 5913-M8-1 | Centrale hydroélectrique Rivière Magpie / Magpie Hydroelectric Project | 38.9 | FY08 | 1,874,967,915 |
| 14 | Hydro | Centrales Chute-Garneau et Pont-Arnaud | QC | Ville de Saguenay | 2 | ecoERP | 5913-V10-1 | Réfection de la Centrale Chute-Garneau | 5.3 | FY11 | 270,221,918 |
| ecoERP | 5913-V10-2 | Réfection de la Centrale Pont-Arnaud | 8.0 | FY11 | 420,825,600 | ||||||
| 15 | Biomass | Grande Prairie Green Energy Phase I | AB | Weyerhaeuser Company Limited | 1 | ecoERP | 5912-W11-1 | Grande Prairie Green Energy Phase I | 48.5 | FY11 | 2,375,989,391 |
| 16 | Biomass | Cedar Road Landfill Project | BC | Cedar Road LFG Inc. | 1 | ecoERP | 5912-C26-1 | Cedar Road Landfill Gas Utilization/Phase One | 1.3 | FY11 | 32,430,144 |
| 17 | Solar | Sarnia Solar Projects | ON | Cruickshank Wind Farm Ltd | 8 | ecoERP | 5915-O10-1 | Sarnia Solar 2 | 10.0 | FY10 | 122,492,231 |
| ecoERP | 5915-O10-2 | Sarnia Solar 3 | 10.0 | FY11 | 108,215,278 | ||||||
| ecoERP | 5915-O10-3 | Sarnia Solar 5 | 10.0 | FY10 | 124,431,283 | ||||||
| ecoERP | 5915-O10-8 | Sarnia Solar 1 | 10.0 | FY11 | 111,778,881 | ||||||
| ecoERP | 5915-O10-4 | Sarnia Solar 4 | 10.0 | FY11 | 111,431,681 | ||||||
| ecoERP | 5915-O10-5 | Sarnia Solar 6 | 10.0 | FY11 | 112,013,125 | ||||||
| ecoERP | 5915-O10-6 | Sarnia Solar 7 | 10.0 | FY11 | 111,919,624 | ||||||
| ecoERP | 5915-O10-7 | Sarnia Solar 8 | 10.0 | FY11 | 110,709,437 | ||||||
| 18 | MREEM | Marine Renewable Energy Enabling Measures (MREEM) project | NA | Natural Resources Canada | 1 | NA | NA | NA | NA | NA | NA |
Page details
- Date modified: