
How are Canada’s forests harvested sustainably?
Sustainable forest management aims to maintain and enhance the environmental, social and economic values of forests for the benefit of present and future generations. It involves conserving biodiversity and protecting forest health, while ensuring the procurement of wood-based products and ecosystem services. Canadian forests are managed under the paradigms and guiding principles of sustainable forest management. In 2021, about 698,000 hectares of forests were harvested in Canada, which corresponds to 0.2% of the forested land.
Key sustainability indicators
Explore the report to find information on the key sustainability indicators:
- Forest area harvested: Annual trends in forest area harvested on private and Crown land. This indicator is important for understanding the level of industrial activity in Canada’s forests and for assessing long-term sustainability of forests and the forest sector.
- Forest regeneration: Measure of area seeded, area planted and number of seedlings planted on provincial and territorial Crown land. Monitoring regeneration activities ensures harvested areas regrow as forests and continue to produce timber and maintain ecosystem services.
- Volume harvested relative to the sustainable wood supply: Information on the annual harvest compared to the supply that is deemed sustainable for harvest. This indicator is important to ensure the volume of industrial roundwood harvested each year falls within sustainable levels.
Download the report
(PDF, 17.8 MB)
Forest area harvested
Key Information
Each year, less than 0.5% of Canada’s 367 million ha of forest land is harvested.
When averaged over the last 10 years, the area harvested each year is around 30% of the total area burned by wildfires, and only 5% of the area defoliated by insects.
The area harvested each year is an important indicator of the level of industrial activity in Canada’s forests. This measure is used in assessing the long-term sustainability of harvesting activities. In 2021, an estimated 698,000 hectares (ha) of forest were harvested, which is a 2.4% decrease compared to 2020, when 715,200 ha were harvested.
- The area of forest harvested in Canada has decreased each year since 2017. This change is due to multiple factors, including reduced harvesting in areas affected by mountain pine beetle, severe wildfires and increased protection of old-growth forests.
- More recently, curtailments due to COVID-19 and weak market conditions have contributed to the decline in the area harvested.
- Compared to 2020, Alberta, Ontario and Yukon experienced the largest decrease in area harvested. In Alberta, the area harvested decreased by 13,400 ha (14%), while in Ontario and Yukon there was a decrease of 6,000 ha (5%) and 2,800 ha (94%), respectively. For the same period, the area harvested increased by 6,950 ha (3%) in Québec.
- Around 85% of the total area harvested in Canada is through clearcutting.
Prior to harvesting, forestry professionals set a list of silvicultural objectives that are shaped by Sustainable Forest Management (SFM) principles. The method of harvest that is then chosen is the one that is most likely to achieve these objectives.
As an example, forested areas shaped by recurring wildfire events are often composed of even-aged stands. For these areas, clearcutting, or one of the variations on this system (e.g., clearcut with reserves that retains uniformly spaced or small groups of trees to provide wildlife habitat, among other benefits), is usually the most appropriate harvesting method as it creates conditions which lead to the rapid regrowth of the forest.
Why is this indicator important?
- Along with volume harvested, the area harvested is a key indicator used to determine if current commercial harvesting practices are sustainable over the long-term.
- Regulations specify that commercial harvesting on Crown land can only occur in areas where it is considered publicly acceptable and economically feasible.
- Measuring change in the area harvested gives insight into the impact that commercial forestry operations have on Canada’s forests.
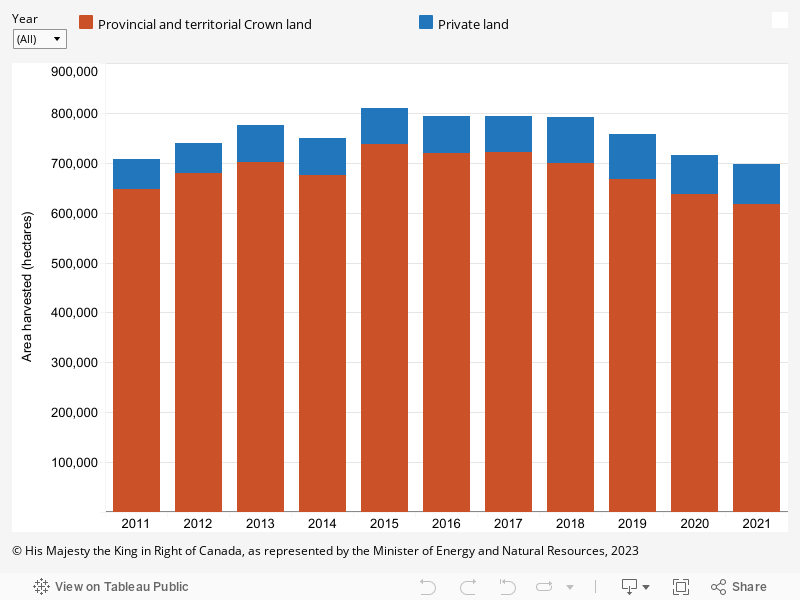
Forest area harvested on private and Crown land in Canada, 2011–2021
Graph summary
Comparison of forest area harvested on Crown lands compared to private lands from 2011 to 2021.
Graph data
Forest area harvested on private and Crown land in Canada, 2011–2021
| Year | Area harvested (hectares) | |
|---|---|---|
| Provincial and territorial Crown land | Private land | |
| 2011 | 647,082 | 61,337 |
| 2012 | 679,446 | 59,517 |
| 2013 | 701,957 | 73,184 |
| 2014 | 675,913 | 73,693 |
| 2015 | 738,316 | 72,296 |
| 2016 | 718,980 | 74,856 |
| 2017 | 721,505 | 72,593 |
| 2018 | 699,754 | 91,876 |
| 2019 | 666,798 | 91,787 |
| 2020 | 636,487 | 78,735 |
| 2021 | 617,379 | 80,646 |
Forest regeneration
Key information
- Successful regeneration is required following forest harvesting on public lands.
- Forest type and silviculture system determine the regeneration method (natural or artificial).
- Artificial regeneration—planting or seeding—has been applied to 59% of the area harvested in the past 20 years.
In 2021, 452,000 half of provincial forest lands in Canada were regenerated by planting and direct seeding. Of that total area, 443,000 ha were planted with 625 million seedlings.
- In 2021, both the area planted and the number of seedlings planted increased nearly 9% compared to the 10-year average.
- Both area planted and seedlings planted are at 10-year highs, which is at least partially due to large reforestation efforts in areas burned by wildfires.
- Direct seeding typically accounts for about 3% of the area artificially regenerated, but in 2021 that proportion declined to 2%. Seeding is only suitable on certain sites and requires large quantities of seeds; both may be factors in the reduced use of seeding.
Why is this indicator important?
- Regeneration activities ensure that harvested areas, and sometimes those that experienced natural disturbances like fire and pests, regrow as forests and continue to produce timber and maintain ecosystem services, such as storing carbon, regulating water quality and providing habitat.
- The method used for regenerating forests can influence forest composition. Most artificial regeneration is to establish coniferous trees.
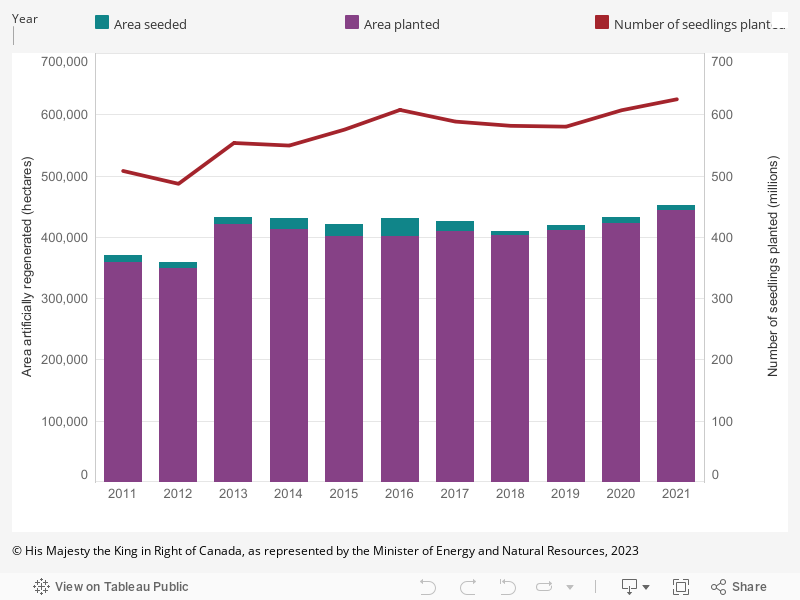
Area artificially regenerated and number of seedlings planted on provincial and territorial Crown lands in Canada, 2011–2021
Graph summary
The number of seedlings planted, and the comparison between the area planted and the area seeded per year from 2011 to 2021.
Graph data
Area artificially regenerated and number of seedlings planted on provincial and territorial Crown lands in Canada, 2011–2021
| Year | Area planted (hectares) |
Area seeded (hectares) |
Number of seedlings |
|---|---|---|---|
| 2011 | 359,175 | 11,202 | 508 |
| 2012 | 348,973 | 10,541 | 487 |
| 2013 | 420,167 | 11,638 | 554 |
| 2014 | 412,939 | 17,268 | 550 |
| 2015 | 401,178 | 19,764 | 576 |
| 2016 | 401,895 | 28,889 | 608 |
| 2017 | 409,083 | 17,563 | 589 |
| 2018 | 403,273 | 6,233 | 582 |
| 2019 | 410,594 | 8,620 | 581 |
| 2020 | 422,758 | 9,259 | 607 |
| 2021 | 443,461 | 8,531 | 625 |
Volume harvested relative to the sustainable wood supply
Key Information
Sustainable wood supply refers to the volume of timber that can be harvested annually from federal, provincial, territorial and private lands, while meeting long-term environmental, economic and social objectives as set out in legislations that regulate timber harvesting. In this indicator, wood supply refers to industrial roundwood supplies only.
In 2021, Canada harvested 147.3 million cubic metres (m3) of industrial roundwood, which is well below the estimated sustainable wood supply level of 215.0 million m3.
- The harvested industrial roundwood volume increased by 6.2 million m3 from 2020 levels. At the same time, the estimated wood supply deemed to be sustainable declined by 272,697 m3.
- The gap between the volume of industrial roundwood harvested and the sustainable wood supply continues to narrow. Nonetheless, the harvested proportion of wood supply is only 1% more than the average over the last decade (from 2011–2020).
- Canada continues to harvest at levels that are below the level deemed to be sustainable.
- The increase in harvest is mostly attributable to net increases in timber volumes harvested in British Columbia and Québec.
Why is this indicator important?
- Forest managers track the volume of industrial roundwood harvested each year to ensure it falls within long-term sustainable levels, as set out in provincial legislation and policies that regulate the harvest on provincial lands.
- Harvests from provincial Crown lands are regulated by the allowable annual cut (AAC) that each province sets. Although there is no AAC calculation for Canada as a whole, it is possible to compare the combined provincial AACs with the combined harvest totals from the same provincial Crown land base.
Annual harvest versus supply deemed sustainable for harvest, 1990–2021
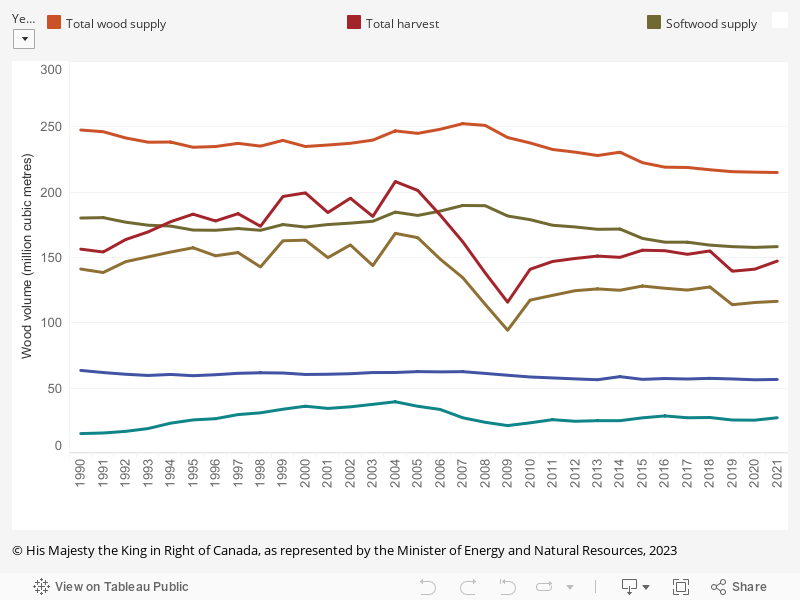
Graph summary
Comparison between the volumes of annual harvest and supply per year for hardwood, softwood, and total between 1990 and 2021.
Graph data
Annual harvest versus supply deemed sustainable for harvest, 1990–2021
| Year | Wood volume (million m3) | |||||
|---|---|---|---|---|---|---|
| Total wood supply | Total harvest | Softwood supply | Softwood harvest | Hardwood supply | Hardwood harvest | |
| 1990 | 247.6 | 156.4 | 180.2 | 141.2 | 63.6 | 15.2 |
| 1991 | 246.3 | 154.2 | 180.5 | 138.5 | 62.0 | 15.7 |
| 1992 | 241.5 | 163.7 | 177.0 | 146.8 | 60.6 | 16.9 |
| 1993 | 238.2 | 169.6 | 174.7 | 150.5 | 59.7 | 19.1 |
| 1994 | 238.4 | 177.4 | 174.0 | 154.2 | 60.5 | 23.2 |
| 1995 | 234.4 | 183.2 | 171.0 | 157.4 | 59.5 | 25.7 |
| 1996 | 234.9 | 177.9 | 170.8 | 151.3 | 60.3 | 26.6 |
| 1997 | 237.4 | 183.6 | 172.2 | 153.8 | 61.4 | 29.8 |
| 1998 | 235.2 | 173.9 | 170.8 | 142.8 | 61.8 | 31.1 |
| 1999 | 239.6 | 196.7 | 175.2 | 162.8 | 61.6 | 33.9 |
| 2000 | 234.9 | 199.5 | 173.3 | 163.3 | 60.5 | 36.2 |
| 2001 | 236.1 | 184.4 | 175.2 | 149.9 | 60.7 | 34.5 |
| 2002 | 237.4 | 195.4 | 176.3 | 159.6 | 61.1 | 35.7 |
| 2003 | 239.8 | 181.4 | 177.7 | 143.8 | 62.0 | 37.6 |
| 2004 | 246.9 | 208.1 | 184.7 | 168.5 | 62.0 | 39.6 |
| 2005 | 245.0 | 201.3 | 182.2 | 165.2 | 62.7 | 36.1 |
| 2006 | 248.1 | 182.5 | 185.5 | 148.7 | 62.5 | 33.7 |
| 2007 | 252.4 | 162.1 | 189.8 | 134.6 | 62.6 | 27.3 |
| 2008 | 251.1 | 138.3 | 189.7 | 114.2 | 61.3 | 23.9 |
| 2009 | 241.8 | 115.8 | 181.8 | 94.3 | 59.9 | 21.4 |
| 2010 | 237.7 | 141.0 | 179.0 | 117.4 | 58.6 | 23.5 |
| 2011 | 232.7 | 147.0 | 174.7 | 121.0 | 57.8 | 25.9 |
| 2012 | 230.6 | 149.3 | 173.4 | 124.6 | 57.1 | 24.7 |
| 2013 | 228.0 | 151.1 | 171.6 | 126.0 | 56.5 | 25.1 |
| 2014 | 230.6 | 150.1 | 171.8 | 124.9 | 58.8 | 25.1 |
| 2015 | 222.6 | 155.6 | 164.6 | 128.2 | 56.7 | 27.3 |
| 2016 | 219.1 | 155.2 | 161.7 | 126.4 | 57.4 | 28.8 |
| 2017 | 218.9 | 152.4 | 161.7 | 125.1 | 57.0 | 27.4 |
| 2018 | 217.1 | 155.0 | 159.5 | 127.5 | 57.5 | 27.5 |
| 2019 | 215.7 | 139.5 | 158.3 | 113.9 | 57.1 | 25.6 |
| 2020 | 215.3 | 141.1 | 157.7 | 115.6 | 56.4 | 25.5 |
| 2021 | 215.0 | 147.3 | 158.3 | 116.5 | 56.7 | 27.4 |
Sources and information
See Sources and information in the downloadable report for detailed sources.
Page details
- Date modified: